<h1>Smoking Out SmokePing: Moving My Latency Graphs to Prometheus + Grafana</h1>
<p>SmokePing has been quietly pinging things from my network for well over a decade. It's a brilliant piece of software — Tobi Oetiker's RRDtool-powered latency grapher, famous for those fuzzy "smoke" bands that show you the <em>distribution</em> of your round-trip times, not just a single averaged line that lies to you. If you've ever watched a Wi-Fi link degrade in real time, the smoke tells the story better than any mean ever could.</p>
</p>
<p>But it had become the last RRD island in my stack. Every other metric I care about — BGP sessions, WAN health, Kubernetes, temperatures, the lot — lives in Prometheus and gets drawn by Grafana. SmokePing ran as its own container on each of my four sites (<code>home1</code>, <code>home2</code>, <code>au</code>, <code>us</code>), each one rendering its own little web UI, each one a separate RRD silo I had to remember existed. I wanted the smoke, but I wanted it next to everything else.</p>
<p>So I ported it. Here's how, and the handful of sharp edges I hit along the way.</p>
<h2>Keep the smoke: smokeping_prober, not blackbox</h2>
<p>The obvious move is <code>blackbox_exporter</code> with its ICMP probe. I didn't want it. Blackbox takes <em>one</em> sample per scrape, so your "latency" is really "whatever the RTT happened to be the instant Prometheus asked." That's fine for up/down, but it throws away the exact thing SmokePing is loved for — the spread.</p>
<p>Enter <a href="https://github.com/SuperQ/smokeping_prober">SuperQ's <code>smokeping_prober</code></a>. It pings continuously (every 10 seconds here — classic SmokePing sent 20 pings a minute, so this is in the same ballpark), bins every round-trip into a Prometheus <strong>histogram</strong>, and exposes <code>smokeping_response_duration_seconds</code> plus a <code>smokeping_requests_total</code> counter for loss. A histogram is exactly what you need to pull real percentiles back out later — which is to say, to draw smoke.</p>
<p>It runs on each host with host networking (so it pings from the host's own vantage point, just like SmokePing did) and the <code>NET_RAW</code> capability for ICMP. The target list is a trivial YAML, grouped the same way my old SmokePing <code>Targets</code> file was:</p>
<pre><code class="language-yaml">targets:
- hosts:
- facebook.com
- google.com
- 8.8.8.8
- 1.1.1.1
interval: 10s
network: ip4
protocol: icmp
- hosts:
- facebook.com
- 2001:4860:4860::8888
interval: 10s
network: ip6
protocol: icmp</code></pre>
<p>Note the two blocks: one <code>ip4</code>, one <code>ip6</code>. A dual-stacked name like <code>facebook.com</code> appears in both, which gives me two separate series I can tell apart later by the <code>ip</code> label. I wasn't about to lose my v4-vs-v6 comparison — that's half the fun of running dual stack.</p>
<h2>Scraping it</h2>
<p>Prometheus (which lives on <code>us</code>) scrapes all four probers. The one trick is a relabel to stamp each series with which host it was probed <em>from</em>, so the per-host dashboards can filter on it:</p>
<pre><code class="language-yaml">- job_name: 'smokeping'
scrape_interval: 15s
static_configs:
- targets: [home1:9374, home2:9374, au:9374, us:9374]
relabel_configs:
- source_labels: [__address__]
regex: '([^:]+):.*'
target_label: probe
replacement: '${1}'</code></pre>
<p>The histogram is cumulative, so there's no need to scrape fast — 15 seconds is plenty even though the prober itself pings every 10.</p>
<h2>Redrawing the smoke in Grafana</h2>
<p>This is the part I cared about. SmokePing's smoke is a set of percentile bands shading from the median outward. In Grafana you reconstruct it with <code>histogram_quantile()</code> over the bucket series — one query per percentile:</p>
<pre><code class="language-promql"># median
histogram_quantile(0.50, sum by (le) (rate(smokeping_response_duration_seconds_bucket{probe="us", host="8.8.8.8", ip!~".*:.*"}[$__rate_interval])))</code></pre>
<p>I draw five of them — p05, p25, median, p75, p95 — then use Grafana's <code>fillBelowTo</code> field override to fill p95 down to p05 and p75 down to p25. Graded opacity on those fills gives you the classic fuzzy band, with a bold line for the median sitting in the middle. Packet loss rides the right-hand axis in red:</p>
<pre><code class="language-promql">clamp_min(
1 - rate(smokeping_response_duration_seconds_count{...}[$__rate_interval])
/ rate(smokeping_requests_total{...}[$__rate_interval]),
0)</code></pre>
<p>The <code>ip!~".*:.*"</code> matcher is the v4/v6 split — no colon in the address means IPv4; <code>ip=~".*:.*"</code> gives you the v6 series instead. One dashboard per probing host, all tucked into a dedicated <strong>SmokePing</strong> folder in Grafana, and — because the whole lot is templated — the HomeNet section (every statically-assigned device on my LAN) is generated straight from my Ansible <code>device_ips</code> dictionary and only appears on the two home dashboards. The <code>au</code> and <code>us</code> boxes don't need to watch my cameras.</p>
<p><a href="http://cooperlees.com/wp-content/uploads/2026/11/smokeping-grafana-dns64.png"><img src="http://cooperlees.com/wp-content/uploads/2026/11/smokeping-grafana-dns64-1024x512.png" alt="SmokePing-style Grafana panel: median latency, smoke bands and packet loss over 12 hours" /></a></p>
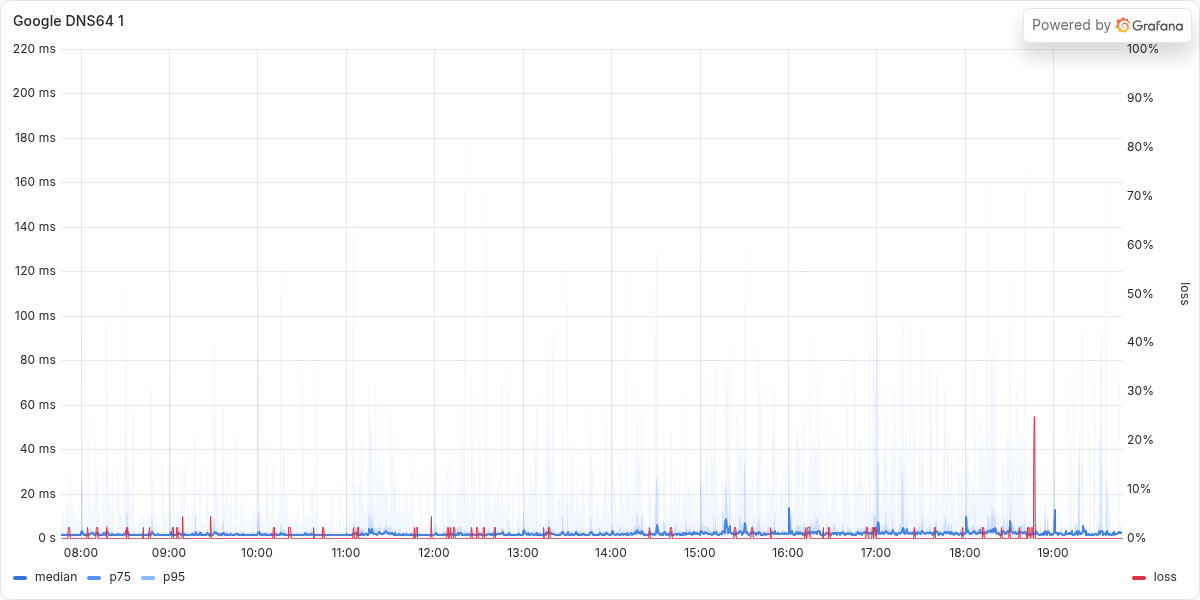
<p><em>The reconstructed smoke in Grafana: the bold blue line is the median, the shaded bands are the p25/p75 and p05/p95 percentiles fanning outward, and packet loss rides the red right-hand axis. This is Google's public DNS64 resolver (<code>2001:4860:4860::6464</code>), probed over IPv6 from my <code>us</code> box — anycast so it sits down near the floor, with the odd smoke spike and a loss blip or two, exactly the picture SmokePing used to give me.</em></p>
<h2>The sharp edges</h2>
<p>Three things bit me. In the spirit of saving future-me the pain:</p>
<ul>
<li><strong>One unresolvable target kills the whole prober.</strong> <code>smokeping_prober</code> resolves every target at startup and <em>fatally exits</em> if even one has no suitable address. My target list includes each site's own name (<code>au.cooperlees.com</code>, etc.), and from <code>au</code> that resolves to <code>au</code> itself — which has no route to ping its own public name, so the prober crash-looped. The fix is to drop each host's own site name from its own config at render time. Templating for the win.</li>
<li><strong>Grafana's file provider scans recursively.</strong> If you drop your new dashboards in a subfolder of the existing provisioning path, the default provider happily loads them a second time into the root folder. I put the SmokePing dashboards in a <em>sibling</em> directory with its own provider pointed at the new "SmokePing" folder, so they land once, in the right place.</li>
<li><strong>Provisioning providers are only read at startup.</strong> Adding the new folder provider did nothing until I bounced the Grafana container. The dashboard JSON files themselves hot-reload; the provider config does not. Ten minutes of "why is my folder empty" before the penny dropped.</li>
</ul>
<h2>Pulling the plug on SmokePing</h2>
<p>Once the four dashboards looked right — and they look <em>good</em>, the smoke is every bit as readable as the RRD originals — I let the whole SmokePing deployment go. The containers are gone from all four hosts, the role is deleted, the RRD data silos with it. Latency history now lives in the same Prometheus as everything else, queryable alongside my BGP state and WAN health, and drawn by the same Grafana I already stare at all day.</p>
<p>As always, the entire thing is Ansible: a new <code>smokeping_prober</code> role, one Prometheus scrape job, and a templated per-host dashboard. Add a target to the YAML, run the playbook, and it shows up on every relevant dashboard automatically. SmokePing, you served honourably. The smoke lives on — it just has a nicer house now.</p>
Smoking Out SmokePing: Moving My Latency Graphs to Prometheus + Grafana
SmokePing has been quietly pinging things from my network for well over a decade. It's a brilliant piece of software — Tobi Oetiker's RRDtool-powered latency grapher, famous for those fuzzy "smoke" bands that show you the distribution of your round-trip times, not just a single averaged line that lies to you. If you've ever watched a Wi-Fi link degrade in real time, the smoke tells the story better than any mean ever could.
But it had become the last RRD island in my stack. Every other metric I care about — BGP sessions, WAN health, Kubernetes, temperatures, the lot — lives in Prometheus and gets drawn by Grafana. SmokePing ran as its own container on each of my four sites (home1, home2, au, us), each one rendering its own little web UI, each one a separate RRD silo I had to remember existed. I wanted the smoke, but I wanted it next to everything else.
So I ported it. Here's how, and the handful of sharp edges I hit along the way.
Keep the smoke: smokeping_prober, not blackbox
The obvious move is blackbox_exporter with its ICMP probe. I didn't want it. Blackbox takes one sample per scrape, so your "latency" is really "whatever the RTT happened to be the instant Prometheus asked." That's fine for up/down, but it throws away the exact thing SmokePing is loved for — the spread.
Enter SuperQ's smokeping_prober. It pings continuously (every 10 seconds here — classic SmokePing sent 20 pings a minute, so this is in the same ballpark), bins every round-trip into a Prometheus histogram, and exposes smokeping_response_duration_seconds plus a smokeping_requests_total counter for loss. A histogram is exactly what you need to pull real percentiles back out later — which is to say, to draw smoke.
It runs on each host with host networking (so it pings from the host's own vantage point, just like SmokePing did) and the NET_RAW capability for ICMP. The target list is a trivial YAML, grouped the same way my old SmokePing Targets file was:
targets:
  - hosts:
      - facebook.com
      - google.com
      - 8.8.8.8
      - 1.1.1.1
    interval: 10s
    network: ip4
    protocol: icmp
  - hosts:
      - facebook.com
      - 2001:4860:4860::8888
    interval: 10s
    network: ip6
    protocol: icmp
Note the two blocks: one ip4, one ip6. A dual-stacked name like facebook.com appears in both, which gives me two separate series I can tell apart later by the ip label. I wasn't about to lose my v4-vs-v6 comparison — that's half the fun of running dual stack.
Scraping it
Prometheus (which lives on us) scrapes all four probers. The one trick is a relabel to stamp each series with which host it was probed from, so the per-host dashboards can filter on it:
- job_name: 'smokeping'
  scrape_interval: 15s
  static_configs:
    - targets: [home1:9374, home2:9374, au:9374, us:9374]
  relabel_configs:
    - source_labels: [__address__]
      regex: '([^:]+):.*'
      target_label: probe
      replacement: '${1}'
The histogram is cumulative, so there's no need to scrape fast — 15 seconds is plenty even though the prober itself pings every 10.
Redrawing the smoke in Grafana
This is the part I cared about. SmokePing's smoke is a set of percentile bands shading from the median outward. In Grafana you reconstruct it with histogram_quantile() over the bucket series — one query per percentile:
# median
histogram_quantile(0.50, sum by (le) (rate(smokeping_response_duration_seconds_bucket{probe="us", host="8.8.8.8", ip!~".*:.*"}[$__rate_interval])))
I draw five of them — p05, p25, median, p75, p95 — then use Grafana's fillBelowTo field override to fill p95 down to p05 and p75 down to p25. Graded opacity on those fills gives you the classic fuzzy band, with a bold line for the median sitting in the middle. Packet loss rides the right-hand axis in red:
clamp_min(
  1 - rate(smokeping_response_duration_seconds_count{...}[$__rate_interval])
    / rate(smokeping_requests_total{...}[$__rate_interval]),
  0)
The ip!~".*:.*" matcher is the v4/v6 split — no colon in the address means IPv4; ip=~".*:.*" gives you the v6 series instead. One dashboard per probing host, all tucked into a dedicated SmokePing folder in Grafana, and — because the whole lot is templated — the HomeNet section (every statically-assigned device on my LAN) is generated straight from my Ansible device_ips dictionary and only appears on the two home dashboards. The au and us boxes don't need to watch my cameras.
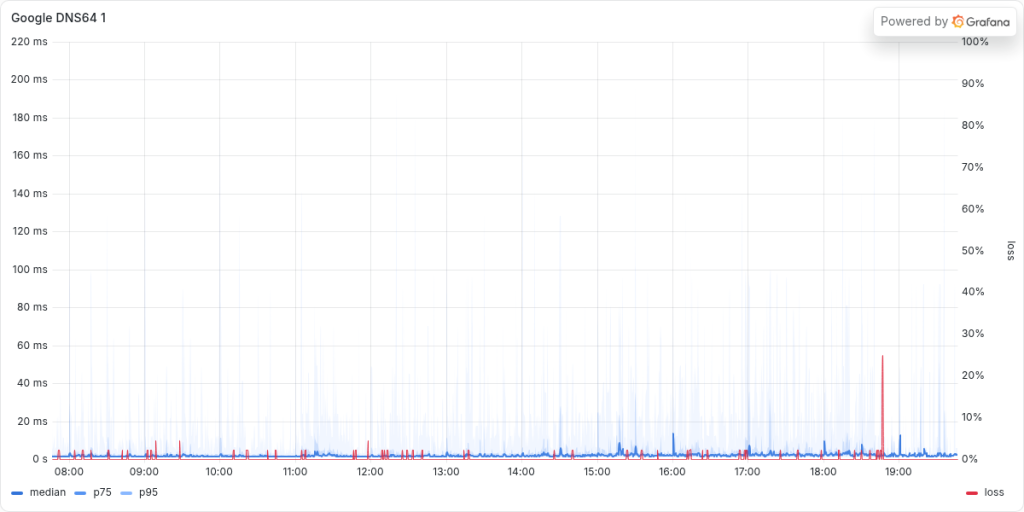
The reconstructed smoke in Grafana: the bold blue line is the median, the shaded bands are the p25/p75 and p05/p95 percentiles fanning outward, and packet loss rides the red right-hand axis. This is Google's public DNS64 resolver (2001:4860:4860::6464), probed over IPv6 from my us box — anycast so it sits down near the floor, with the odd smoke spike and a loss blip or two, exactly the picture SmokePing used to give me.
The sharp edges
Three things bit me. In the spirit of saving future-me the pain:
- One unresolvable target kills the whole prober.
smokeping_prober resolves every target at startup and fatally exits if even one has no suitable address. My target list includes each site's own name (au.cooperlees.com, etc.), and from au that resolves to au itself — which has no route to ping its own public name, so the prober crash-looped. The fix is to drop each host's own site name from its own config at render time. Templating for the win.
- Grafana's file provider scans recursively. If you drop your new dashboards in a subfolder of the existing provisioning path, the default provider happily loads them a second time into the root folder. I put the SmokePing dashboards in a sibling directory with its own provider pointed at the new "SmokePing" folder, so they land once, in the right place.
- Provisioning providers are only read at startup. Adding the new folder provider did nothing until I bounced the Grafana container. The dashboard JSON files themselves hot-reload; the provider config does not. Ten minutes of "why is my folder empty" before the penny dropped.
Pulling the plug on SmokePing
Once the four dashboards looked right — and they look good, the smoke is every bit as readable as the RRD originals — I let the whole SmokePing deployment go. The containers are gone from all four hosts, the role is deleted, the RRD data silos with it. Latency history now lives in the same Prometheus as everything else, queryable alongside my BGP state and WAN health, and drawn by the same Grafana I already stare at all day.
As always, the entire thing is Ansible: a new smokeping_prober role, one Prometheus scrape job, and a templated per-host dashboard. Add a target to the YAML, run the playbook, and it shows up on every relevant dashboard automatically. SmokePing, you served honourably. The smoke lives on — it just has a nicer house now.