How much of your bloody traffic is actually IPv6? Counting IP families with nftables
Look, mate, I love IPv6. Addresses the size of a small country, end-to-end connectivity that IPv4 traded away for a fistful of NAT tables, a protocol that's been "about to take over any minute now" since before half the internet's sysadmins started shaving. I've been flying the v6 flag for years.
But when someone asks me "how much of your traffic is actually IPv6?" I used to wave my hands. A lot. Vague gestures toward the dashboard, mumbled excuses about conntrack. No more. Turns out the answer is three lines of nftables per chain, and it's about time I pulled my (well claude's) finger out and generate this data.
TL;DR
- Drop counter-only rules with
meta nfproto ipv{4,6}+ a descriptivecommentat the top of each base chain you care about. - Don't trust
ct state established,relatedor nat masquerade counters for bandwidth — they're protocol-agnostic and lossy respectively. - Sum by
commentin Prometheus, multiply by 8, call it bps. Divide one sum by another to get a percent. Easy. - Confront your feelings about your actual IPv6 ratio like the grown-up network operator you almost are.
Why the obvious answer doesn't work
You'd reckon you could just add up the rule counters nftables already maintains, ship them via metal-stack/nftables-exporter, graph them, and call it a day. You'd be wrong. Three problems are waiting for you like a spider in a dunny:
1. ct state established,related counter accept is a bloody black hole. That single rule catches the overwhelming majority of return traffic — every WAN→LAN byte of a conversation your LAN kicked off. It has no protocol dimension. source_addresses=any. input_interfaces=any. Zero signal. You might as well count clouds.
2. Your other accept rules are protocol-agnostic. iifname "eth0", tcp dport 22, iifname "wg0" — they count bytes just fine, but they count them as a smudge of both families. v4 and v6 blurred into a single number. Useless for what we're trying to do.
3. Masquerade counters in the nat table lie. You might think counting oifname "eth0" ... counter masquerade is a decent proxy for egress. I did too. Then I compared them to my filter FORWARD counters and found the nat numbers were ~1000× smaller. Turns out conntrack fast-paths flows past the nat chain after the first packet — perfect for NAT semantics, absolutely cooked for byte accounting.
The fix: counter-only rules, at the top of the chain
nftables has a lovely, underused trick: rules with a counter statement and no verdict. They match, increment, and fall through to the next rule. Zero impact on firewall logic. The packet keeps moving. Nothing gets accidentally accepted or dropped.
Combine that with meta nfproto ipv4 / meta nfproto ipv6 to split families, iifname / oifname to split direction, and a comment that the exporter turns into a Prometheus label. Here's what goes in FORWARD on a router with two WANs (att and astound):
chain FORWARD {
    type filter hook forward priority filter; policy drop;

    # --- Family + interface counters. Top of the chain so every packet
    # --- gets counted before downstream accept rules terminate eval.
    iifname "att"     meta nfproto ipv4 counter comment "wan-ingress-att-ipv4"
    iifname "att"     meta nfproto ipv6 counter comment "wan-ingress-att-ipv6"
    oifname "att"     meta nfproto ipv4 counter comment "wan-egress-att-ipv4"
    oifname "att"     meta nfproto ipv6 counter comment "wan-egress-att-ipv6"
    iifname "astound" meta nfproto ipv4 counter comment "wan-ingress-astound-ipv4"
    iifname "astound" meta nfproto ipv6 counter comment "wan-ingress-astound-ipv6"
    oifname "astound" meta nfproto ipv4 counter comment "wan-egress-astound-ipv4"
    oifname "astound" meta nfproto ipv6 counter comment "wan-egress-astound-ipv6"

    # ... your existing firewall rules stay untouched below ...
    ip6 nexthdr icmpv6 counter accept
    ip saddr fc00::/7 counter accept
    # ... etc.
}
And for INPUT / OUTPUT (router-local traffic), the no-frills version:
chain INPUT {
    type filter hook input priority filter; policy drop;
    meta nfproto ipv4 counter comment "input-ipv4"
    meta nfproto ipv6 counter comment "input-ipv6"
    # ... existing rules ...
}

chain OUTPUT {
    type filter hook output priority filter; policy accept;
    meta nfproto ipv4 counter comment "output-ipv4"
    meta nfproto ipv6 counter comment "output-ipv6"
}
Ordering matters. Put these at the top. Put them below an accept and they'll never see the packets that were just sent off to their happy path. Yes, that also means you'll count packets that subsequently get dropped by policy — on a sensible home/edge router that's a rounding error and not worth the mental overhead of surgery.
Nat table? Leave it alone. For the reasons in problem #3 above.
Wiring it up to Prometheus
If you're already running metal-stack/nftables-exporter, you're done. It emits:
nftables_rule_bytes{family="inet", chain="FORWARD", comment="wan-egress-att-ipv6", ...}
nftables_rule_packets{...same labels...}
Your comment becomes a label. Queries become trivial.
The maths
Bytes become bits per second with a rate and a multiply-by-eight, because humans like bps on network graphs:
# Total egress bps through all WAN interfaces on $host, split by family
8 * sum by (comment) (
  rate(nftables_rule_bytes{instance="$host", comment=~"wan-egress-.*"}[5m])
)
Stacked area chart, one stripe per WAN × family. Fair dinkum beautiful.
Want the percentage? Classic sum-over-sum:
# IPv6 as a percent of WAN egress on $host
100 *
  sum(rate(nftables_rule_bytes{instance="$host", comment=~"wan-egress-.*-ipv6"}[5m]))
/
  sum(rate(nftables_rule_bytes{instance="$host", comment=~"wan-egress-.*"}[5m]))
Swap egress for ingress to look at the other direction. Swap ipv6 for ipv4 if you want to stare at the number that refuses to die.
What the numbers actually said
Here's what my home1 router (two WANs, att primary, astound backup) was counting a few minutes after I rolled this out. Cumulative bytes since the rules loaded:
  wan-ingress-att-ipv6     3,671,749 bytes   (3.5 MB)
  wan-ingress-att-ipv4     1,650,060 bytes   (1.57 MB)
  wan-egress-att-ipv6      9,155,663 bytes   (8.73 MB)
  wan-egress-att-ipv4      8,451,381 bytes   (8.06 MB)
  wan-ingress-astound-*            0          (idle backup)
  wan-egress-astound-*             0
Put those through the formula:
- IPv6 % of WAN ingress (home1): 3,671,749 / (3,671,749 + 1,650,060) × 100 ≈ ~69 %
- IPv6 % of WAN egress (home1): 9,155,663 / (9,155,663 + 8,451,381) × 100 ≈ ~52 %
Now that's more like it. A clear v6 majority inbound — which makes sense, big content providers (Google, Facebook, Netflix, Cloudflare) all serve v6 by default, and any modern client behind my router will happy-eyeball its way onto the v6 path every time. Egress is closer to a coin flip because there's still a long tail of outbound connections to services that refuse to put AAAA records on their hostnames. You know who you are (Discord, Github, Steam ...).
And over at my home2 site, where I run a Hurricane Electric IPv6 tunnel because my ISP there thinks IPv6 is a mythological creature:
The other end of the spectrum: my home2 site, where I run a Hurricane Electric IPv6 tunnel because my ISP there thinks IPv6 is a mythological creature:
- IPv6 % of WAN egress (home2): around 83 %
Why the difference? Because the handful of boxes behind home2 happy-eyeball their way to v6 first, and the moment the tunnel's healthy that's what they ride. Which is how the web should bloody well work everywhere.
Why not sFlow, NetFlow, eBPF, etc.?
Fair question. If you want per-host, per-AS, per-L7-protocol deep telemetry, go reach for sFlow via hsflowd or roll an eBPF exporter with XDP + TC hooks (cloudflare/ebpf_exporter has the bones). I looked at all of them for this.
For "IPv4 vs IPv6 per WAN", nftables counters win on three axes:
- Accuracy. Every byte, no sampling. sFlow's 1-in-1000 is great for top-N talkers, useless for "is this 12 % v6 or 15 %".
- Overhead. A pointer deref per packet. You can't really beat it.
- Moving parts. Zero new daemons. You already run the exporter. You already scrape it. You already have a dashboard.
If you want the richer story (who, what app, which AS), add sFlow/eBPF alongside this — don't replace it. They answer different questions.
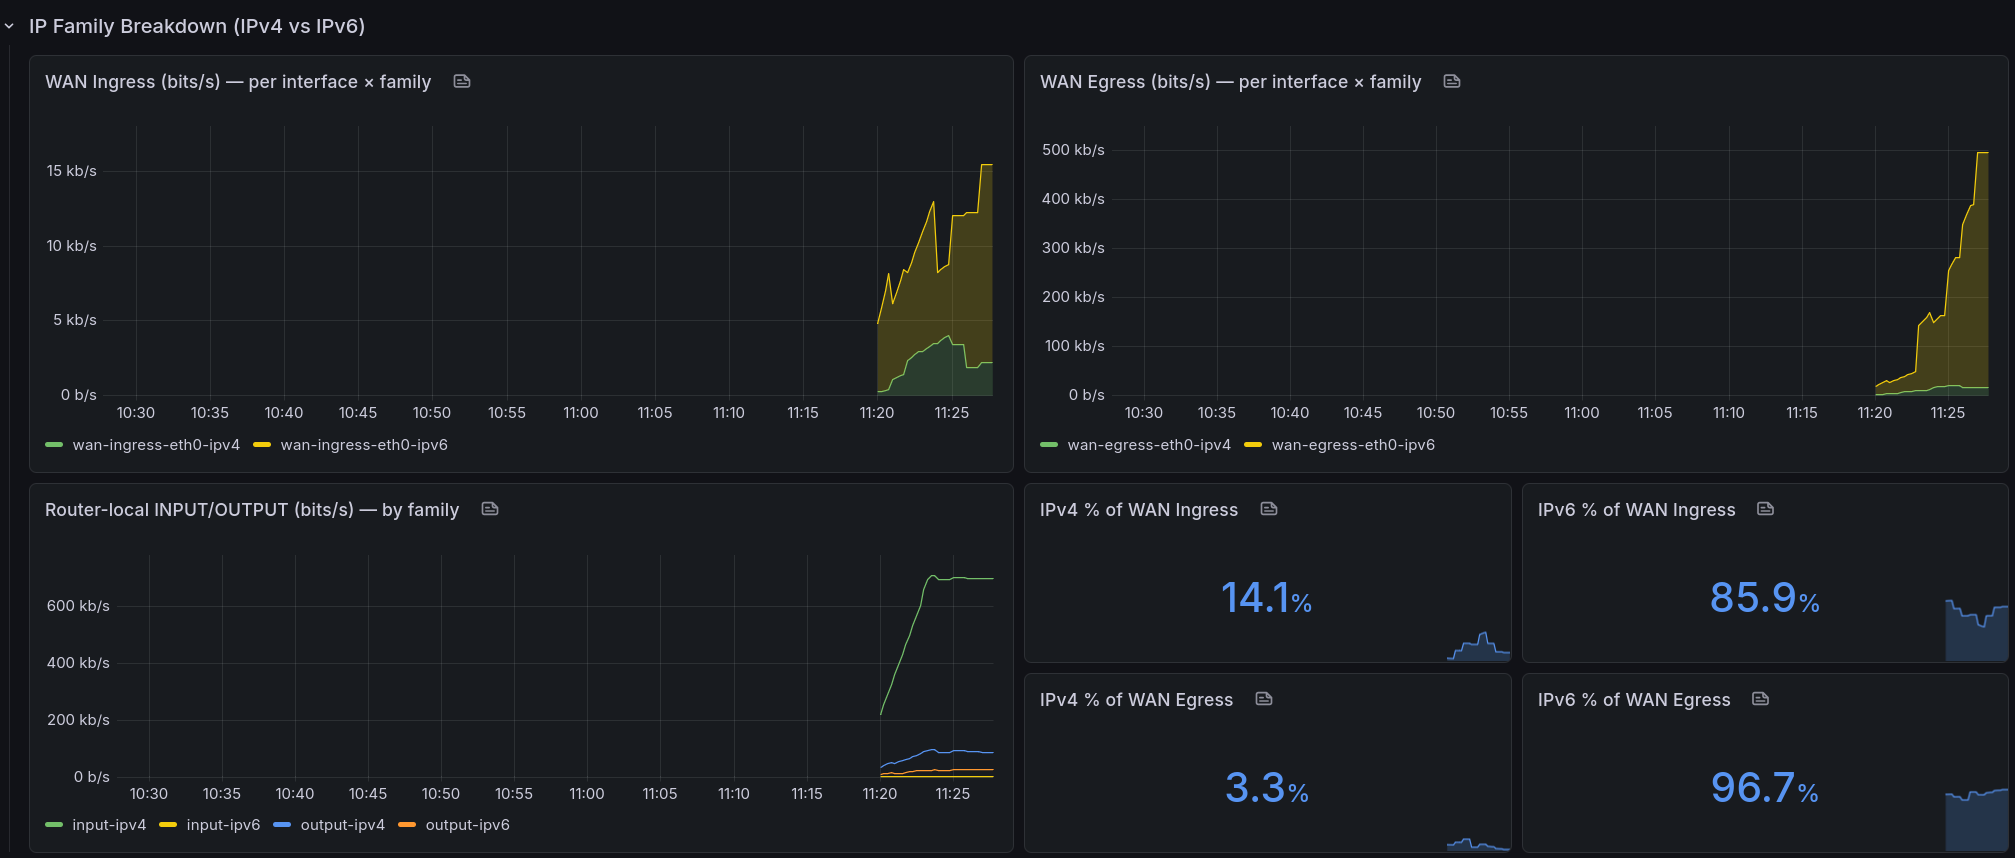
Three rows on my nftables Grafana dashboard:
- Generic nftables — the default per-chain packets/sec panels you probably already had lying around.
- Logs (loki) — panels for my drop logs, separate row so they stop cluttering the metrics above.
- IP Family Breakdown — the new kids. Stacked WAN ingress bps, stacked WAN egress bps, a per-family router-local panel, and a 2×2 grid of stat panels for IPv4 % / IPv6 % on each direction.
The $host variable uses label_values(nftables_rule_bytes, instance) so every router/VPS in the fleet shows up automatically — I add an exporter, the dropdown grows, dashboard works. No surgery required. If you want pretty display names instead of home1v6:9630, Grafana's regex extract will do it, but be careful: some versions of Grafana rewrite the value as well as the text when you use (?<text>…), and your panels go silent. Ask me how I know.
I will try to upload my dashboard, grafana's down at the moment as I write this ... Will edit and link once up.
Cheers.
Write a Reply or Comment