I've been running nftables for years. But I've never sat down to get good telemetry for it. For firewalls to get good telemetry coverage I feel you need:
- Rule Statistics
- See what rules are getting hit
- Overly hot rules
- Rules no longer getting hit (cleanup)
- Logs + Analysis
- Summarized traffic reports (look for trends you don't expect)
- More so important, knowning what traffic is being dropped
- External Scanning
- Premptively look for unexpectedly allowed traffic
- Possibly due to over zealous rules
So I'm going to explain what I've done in early 2026 to improve this and my over all security posture with current tools available for nftables to potentially help you posture your firewalling setup better.
Rule Statistics
To capture rule statistics, since I'm a prometheus / grafana infra I'm using nftables-exporter by metal-stack.
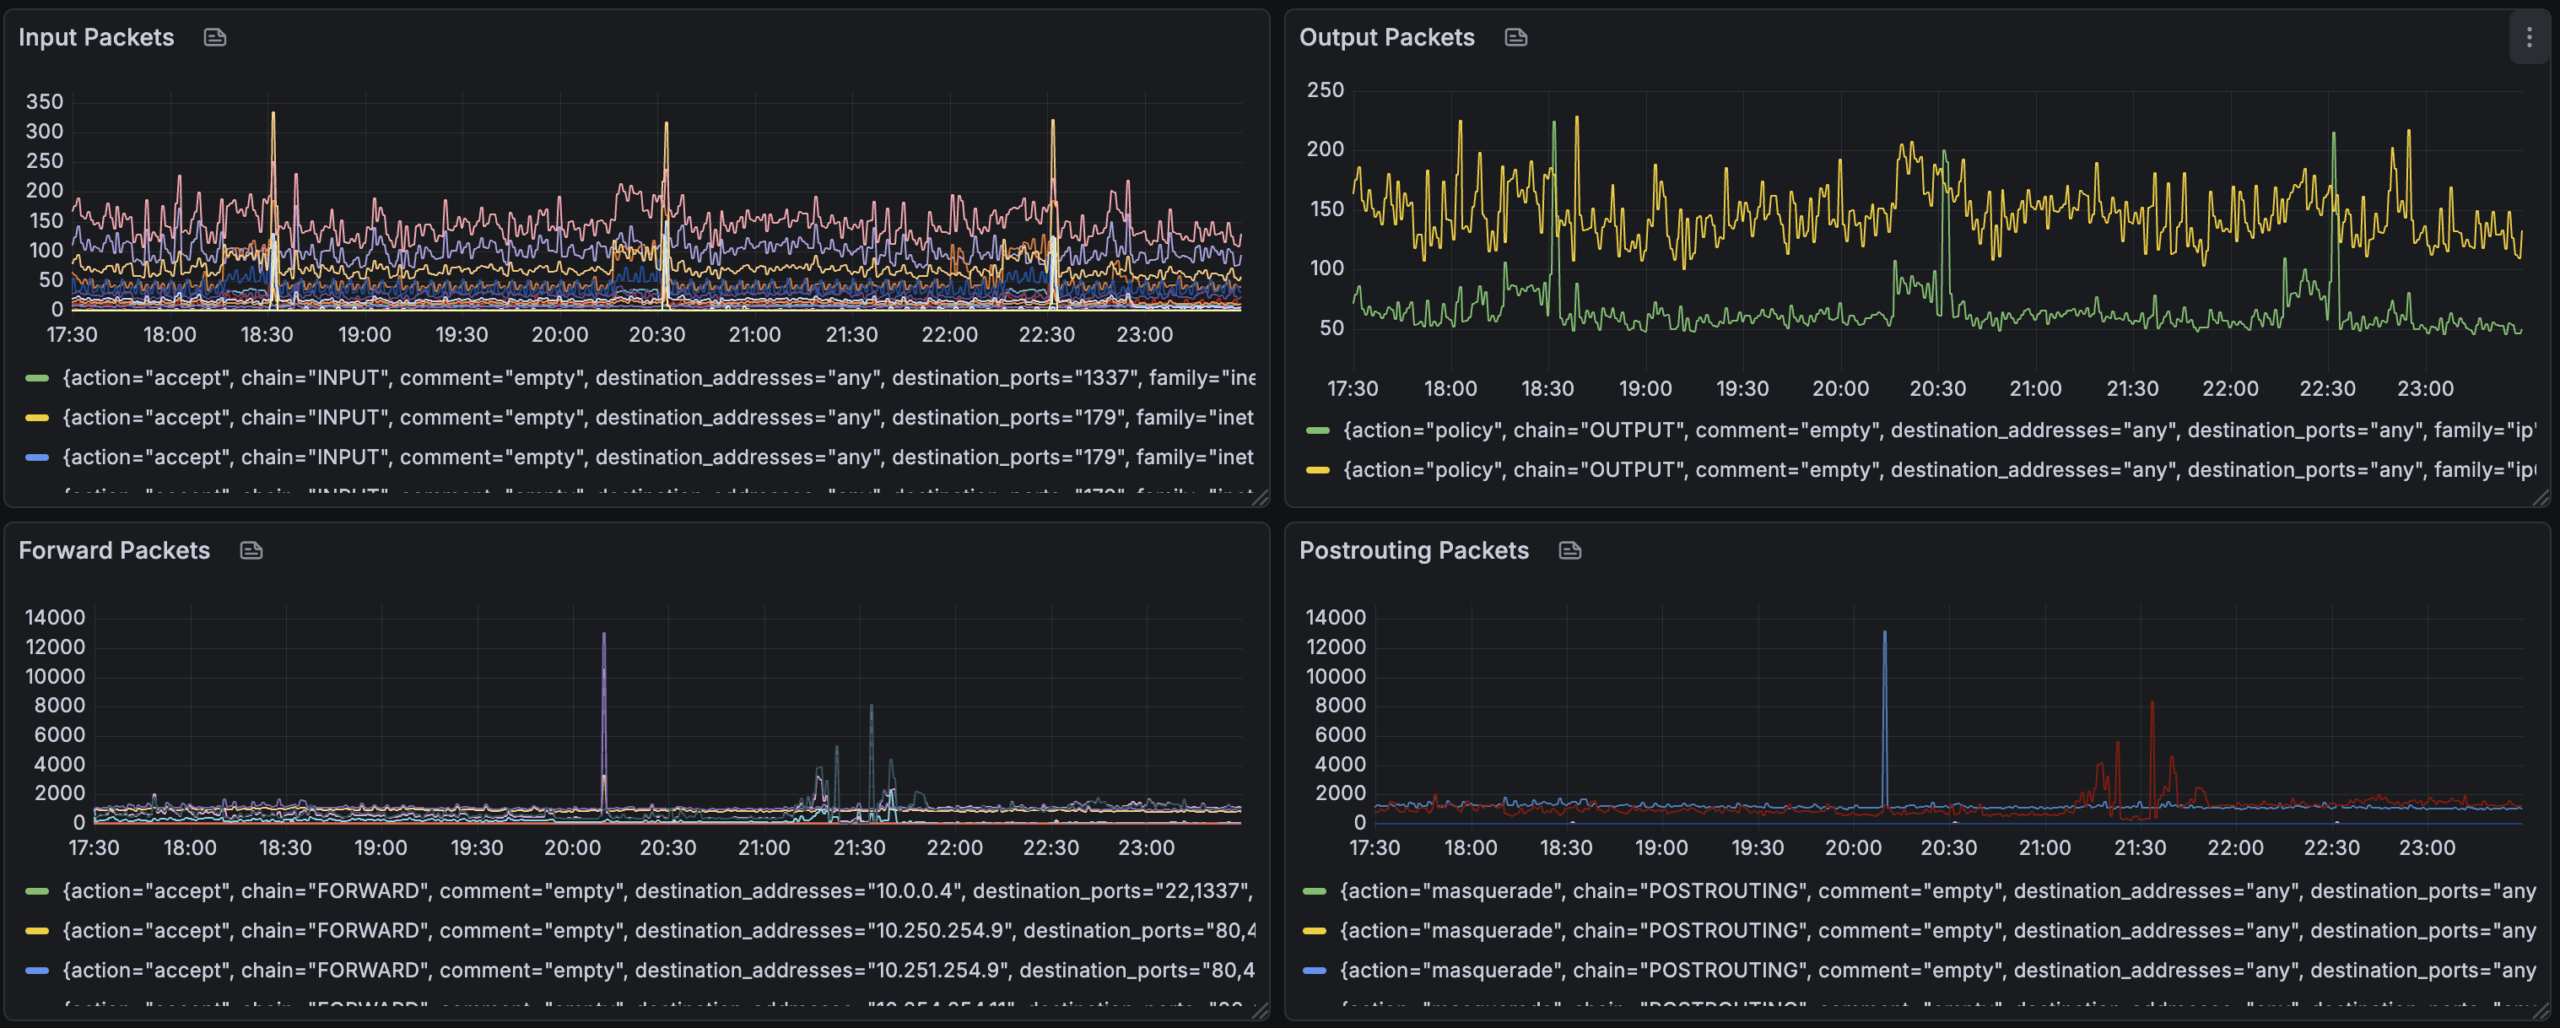
This has allowed me to timeseries graph nft -j list ruleset output in the following ways:
- Show packet counts for each "chain" per rule
Logs + Analysis
For logs I am capturing the dropped packets via drop rules like:
chain LOGGING-VERBOSE {
limit rate 1/second counter log flags all prefix "verbose-nft-dropped: "
counter drop
}
chain LOGGING {
limit rate 2/minute counter log prefix "nft-dropped: "
counter drop
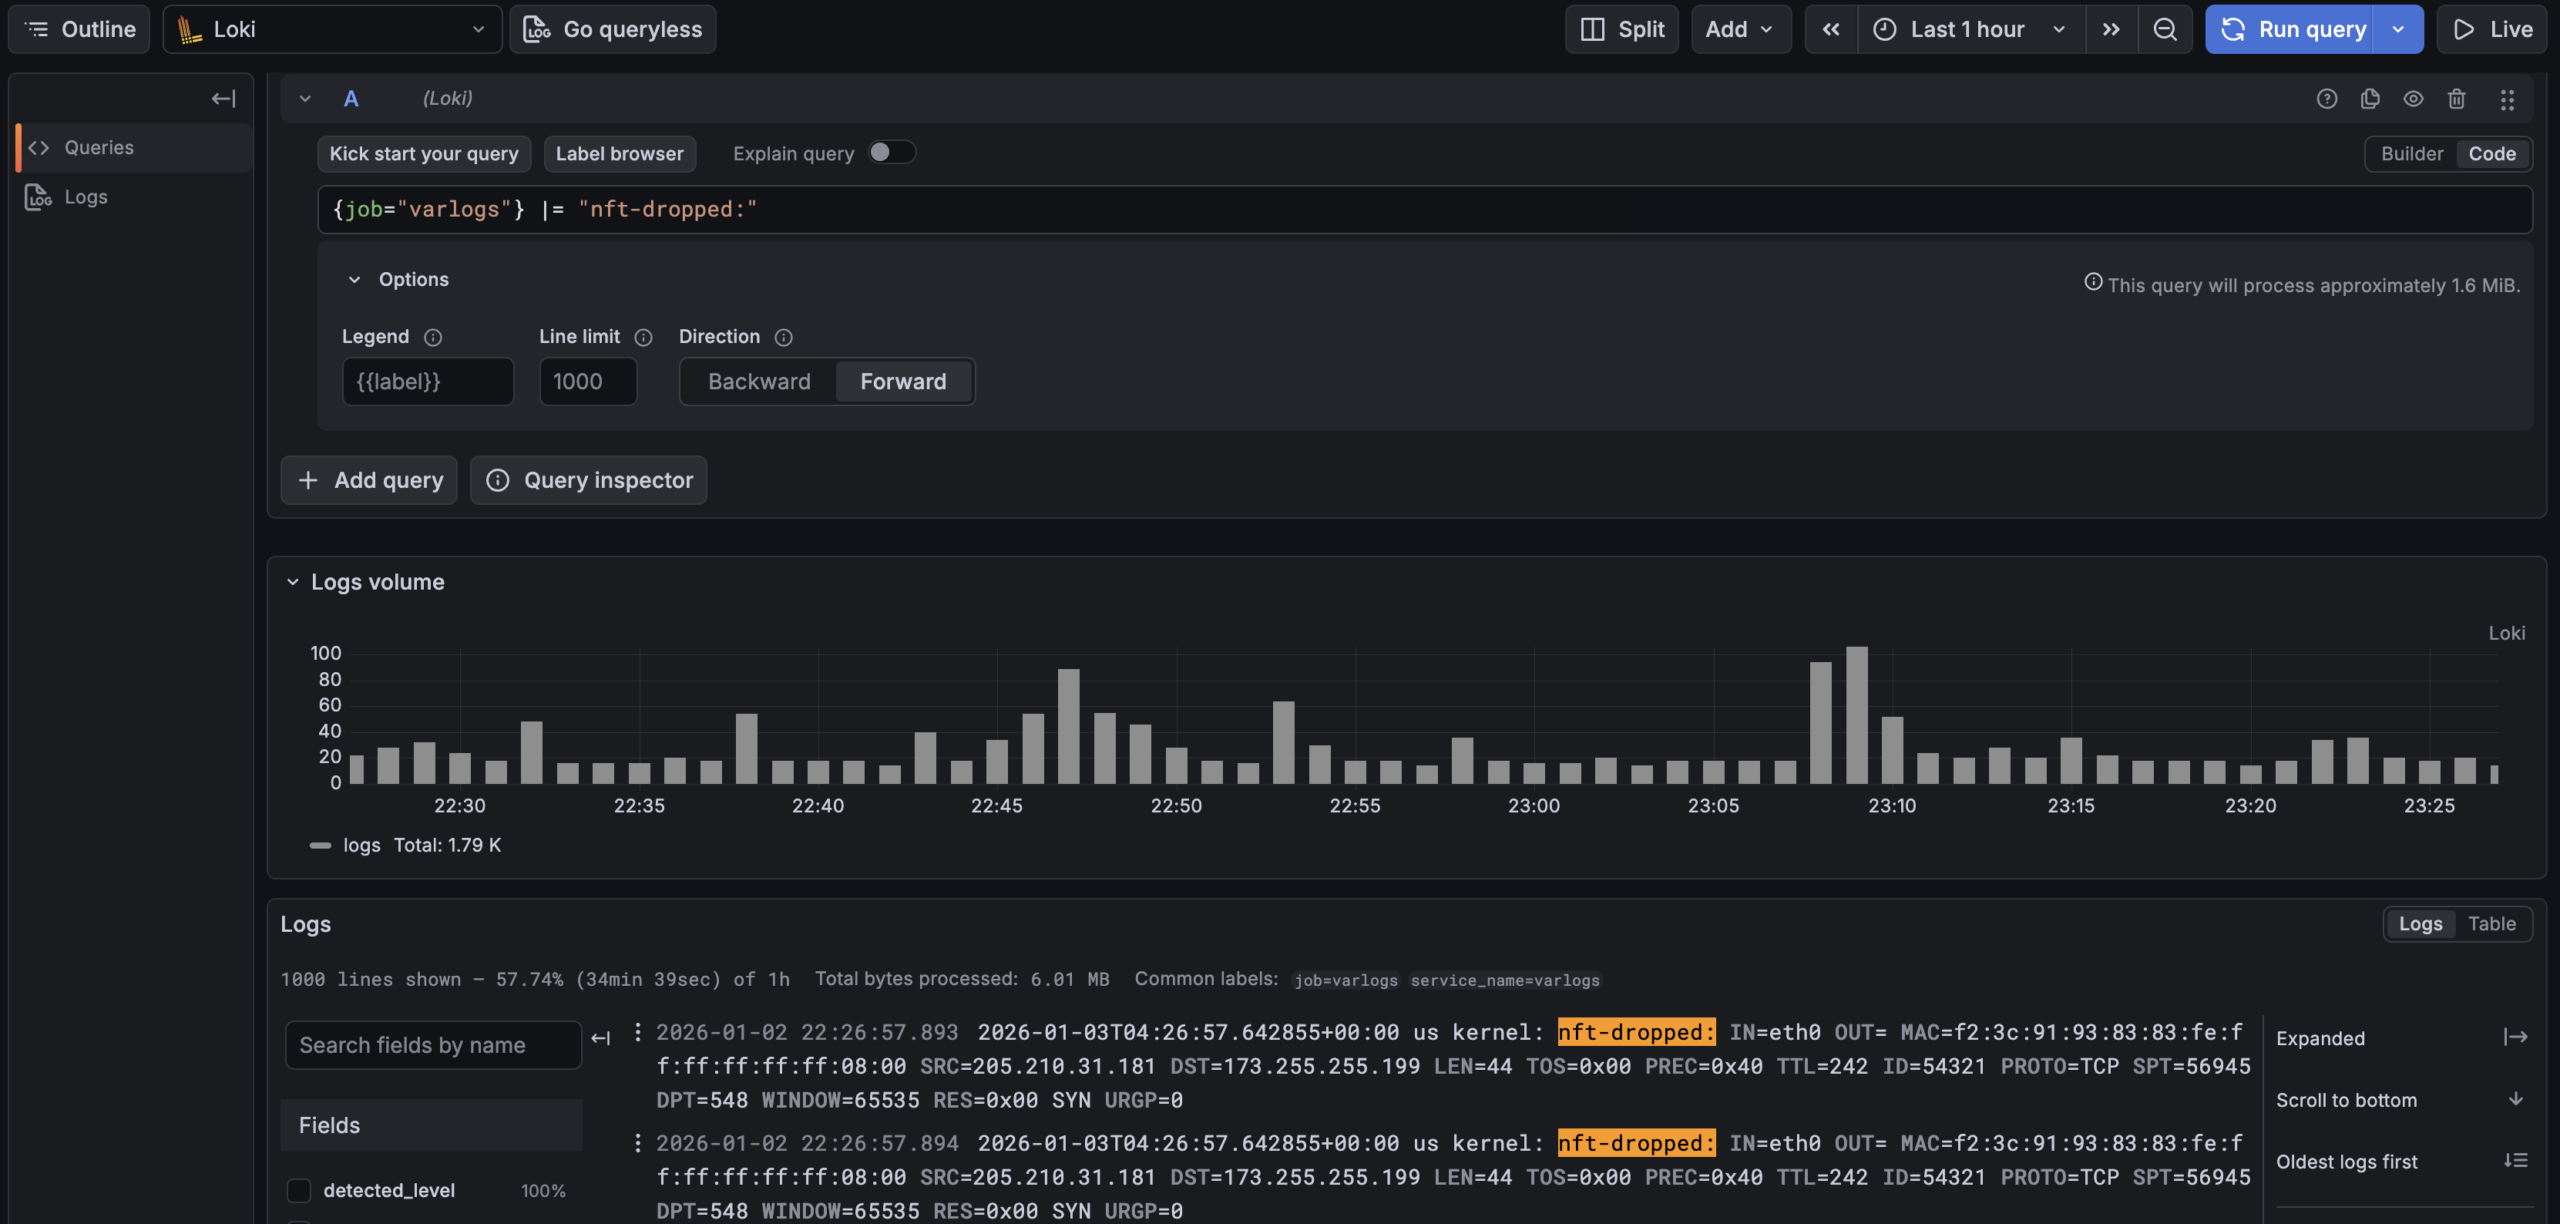
}by promtail into Grafana Loki. So I can use logql to query all my dropped traffic. Due to the nftables log lines being key value pairs the built in "logfmt" parser can make many parts of the log line to be "lables" to filter with.
Some things I can ask:
- How many dropped flows per host are being collected
sum by (hostname) (count_over_time({job="varlogs"} |= "nft-dropped:" [$__interval]))
- Regex away finding flows to port 69
{job="varlogs"} |~ "nft-dropped:.*DPT=69"
- Use logfmt to get counts of destination hosts, protocol and port:
sum by (DST, PROTO, DPT) (
count_over_time(
{job="varlogs", hostname="home1.cooperlees.com"} |= "nft-dropped" | logfmt [$__interval]
)
)
This is insaley handly to slice and slice the data to work out rules to potetially add / cleanup.
Jan  3 04:18:26 home1 kernel: verbose-nft-dropped: IN=att OUT=vlan69 MACSRC=0c:a4:02:c9:06:d5 MACDST=bc:9a:8e:88:56:c0 MACPROTO=86dd SRC=2a06:4880:6000:0000:0000:0000:0000:0089 DST=2600:1700:3040:13e1:0000:0000:0000:0069 LEN=64 TC=0 HOPLIMIT=241 FLOWLBL=270679 PROTO=TCP SPT=36289 DPT=55553 SEQ=3101165342 ACK=0 WINDOW=14600 RES=0x00 SYN URGP=0 OPT (020405A0)
# Legacy IP
Jan  3 05:03:21 home2 kernel: nft-dropped: IN=astound OUT= MAC=66:69:69:69:69:69:6c:9c:ed:92:00:26:08:00 SRC=79.124.56.246 DST=207.229.169.25 LEN=40 TOS=0x00 PREC=0x00 TTL=239 ID=47457 PROTO=TCP SPT=56038 DPT=6961 WINDOW=1024 RES=0x00 SYN URGP=0
I haven't yet, but could add more logging to get data on what traffic is allowed. I am planning to do this for my new child vlan I plan to create as I add devices for my child.
External Scanning
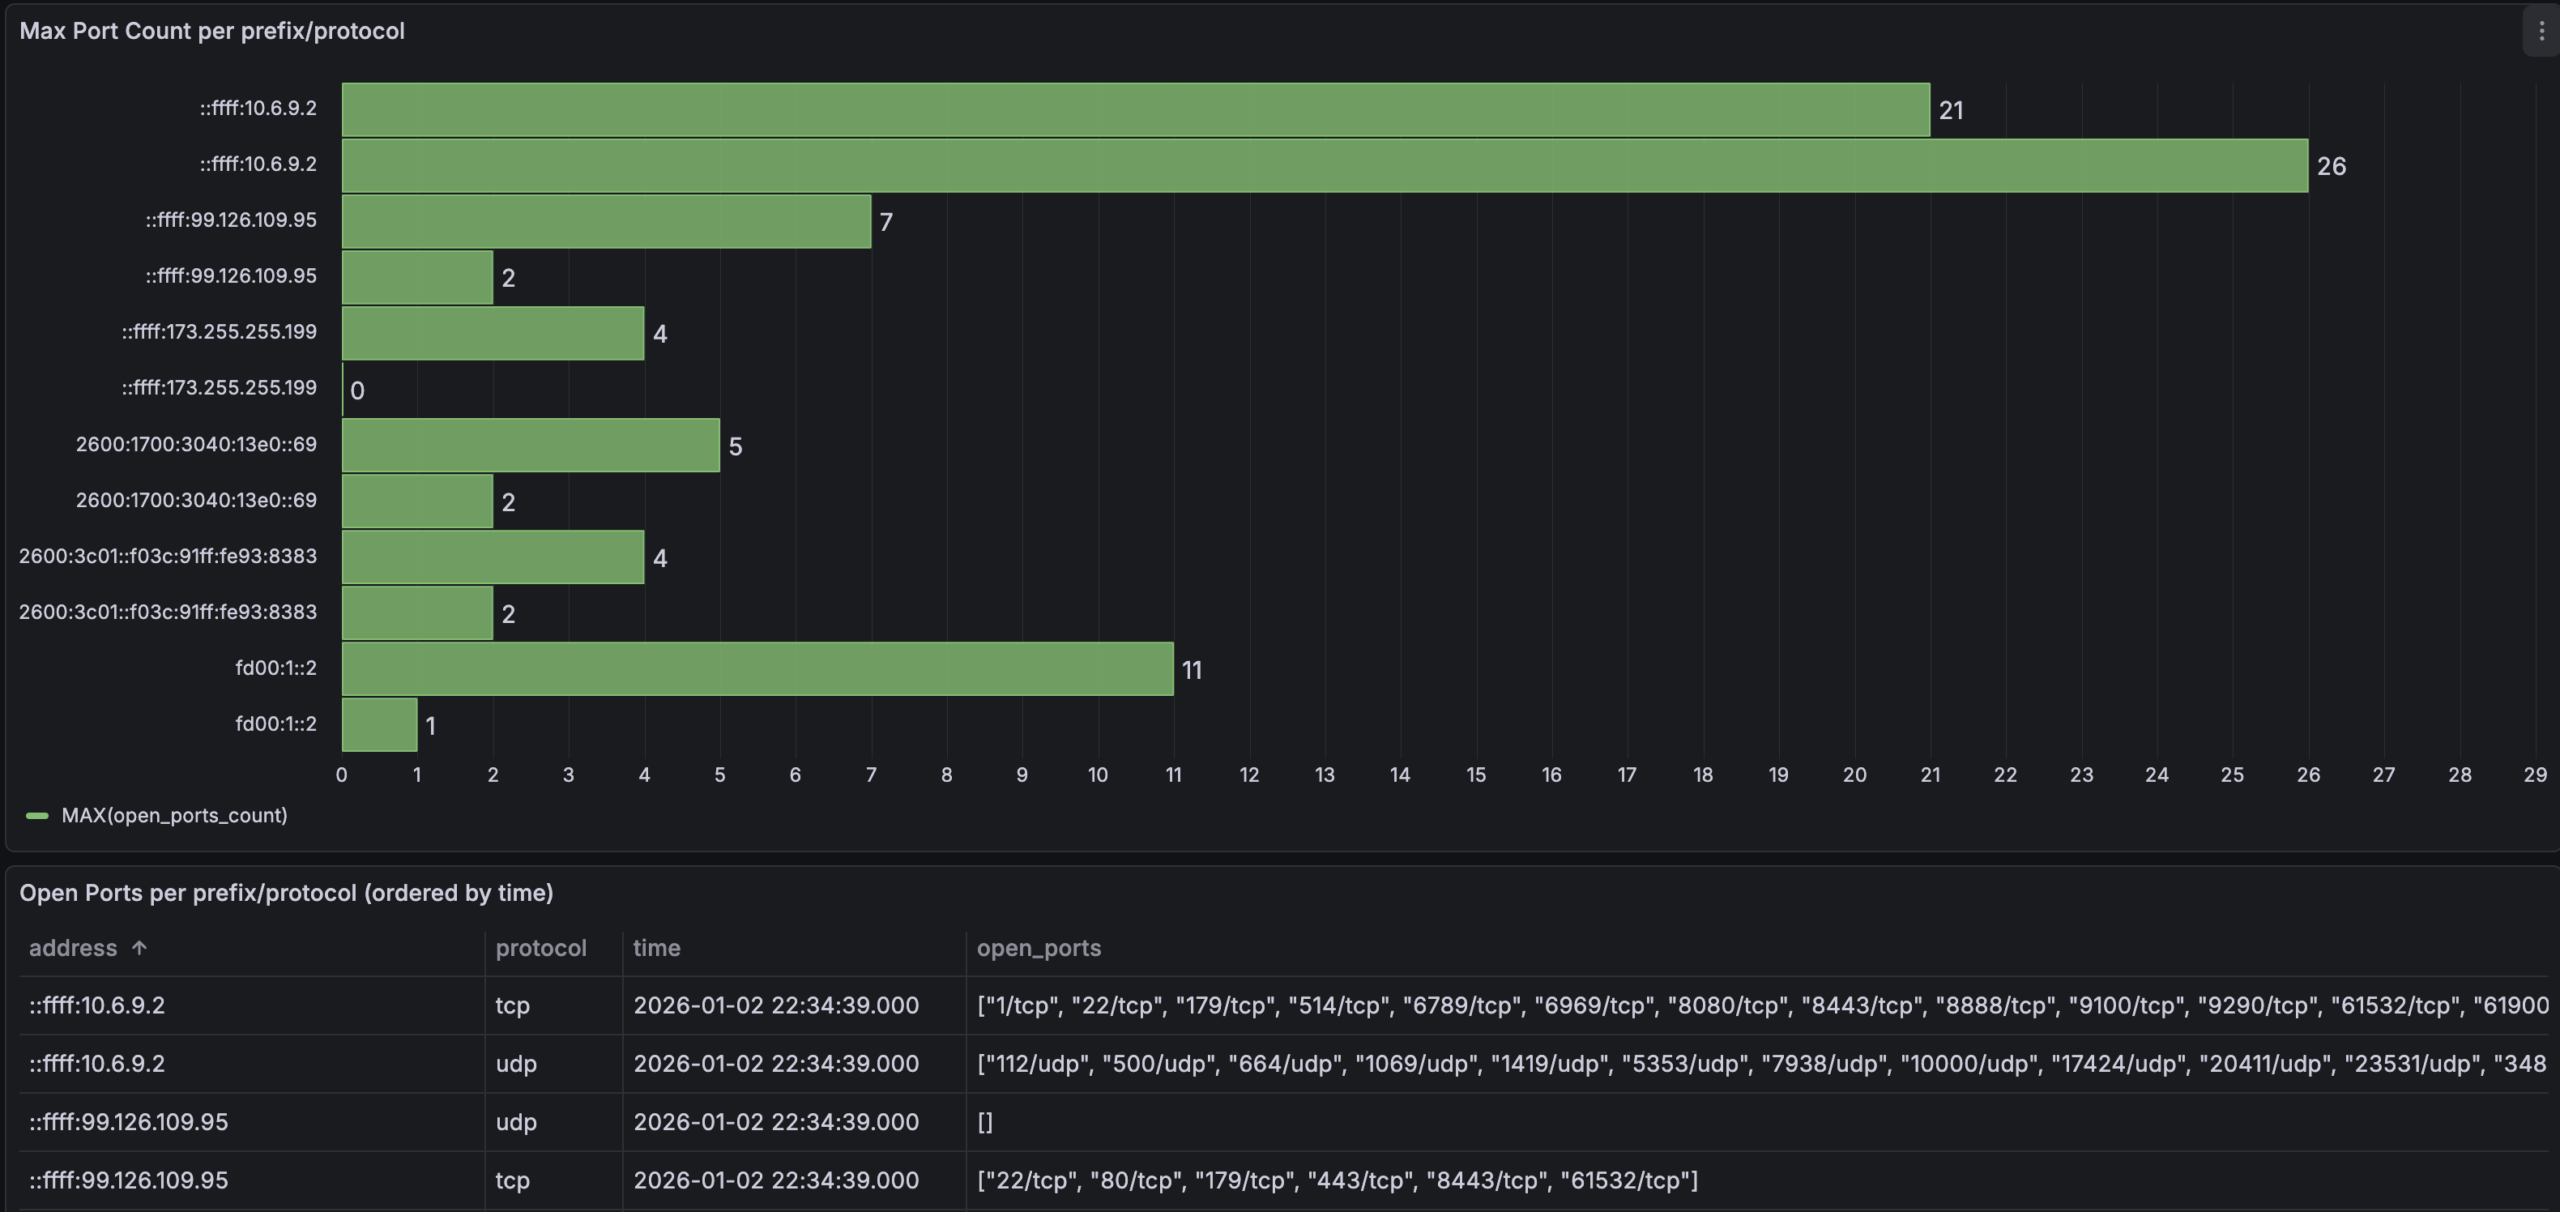
The next thing to do is to periodically port scan endpoints from sources to see you only get expected results. To do this I wrapped nmap to write scan results into a mysql table, I amazingly called it nmapscanner
This tool takes lists of IPs to scan and write to mysql. I then use Grafana to do SQL queries to see what ports are seen open etc.
Please comment away any better way to do things and concepts or ways to analyze I've overlook. I'm always ears for smarter and better ways to look at systems I run on my infra.
Keep firewalling all.
Write a Reply or Comment